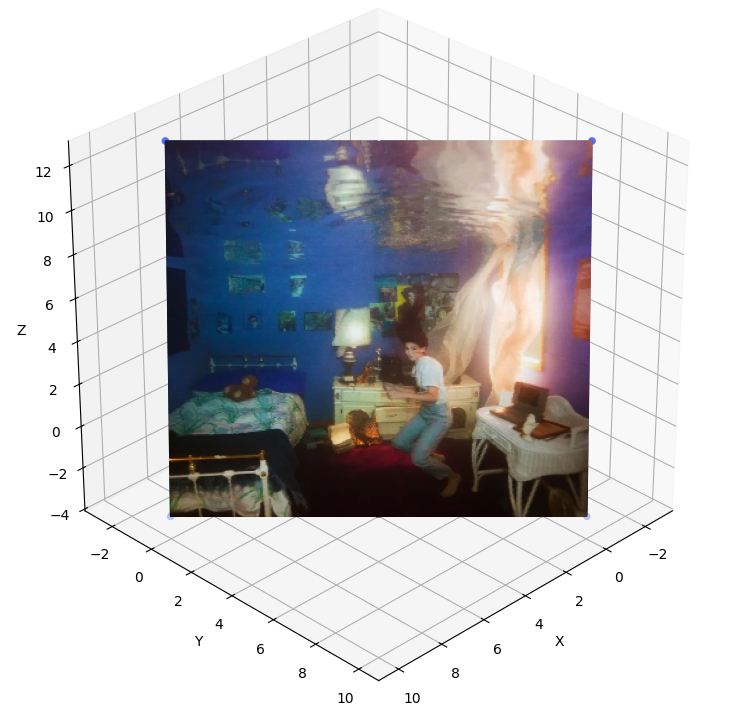
Axes3D.plot_surface() example

Plotting an image in 3D.
Plotting an image in 3D given the point coordinates of its corners.
Call points_to_grid() to generate a 3D meshgrid from the corner points.
Call plot_surface() to plot image[i][j] at [mesh_x[i][j], mesh_y[i][j], mesh_z[i][j] in 3D space.
Note: this method of plotting images in 3D is hack-y and slow and impractical for actual use. It’s just for fun to texture our basic box objects.
import numpy as np
import matplotlib.pyplot as plt
import cv2

def points_to_grid(pts, dimx, dimy):
    """
    Returns meshgrid of coordinates to plot an image of dimension dimx x dimy, given its corners in pts.

    Args:
        pts (ndarray): clockwise corner points starting with top left in row major order
        dimx (int): dimx of image
        dimy (int): dimy of image

    Returns:
        tuple (ndarray, ndarray, ndarray): x y and z meshgrids
    """

    meshes = []
    for i in range(3):
        x1, x2, x3, x4 = pts[i]
        meshes.append(np.linspace(np.linspace(x1, x2, dimx), np.linspace(x4, x3, dimx), dimy))
    return meshes[0], meshes[1], meshes[2]

im = cv2.cvtColor(cv2.resize(cv2.imread('titanic_rising.jpg'), (600, 600)), cv2.COLOR_BGR2RGBA)/255

# cornerpoints of our image in 3d space (row major)
pts = np.array([[7.5, -2.5, 12], [-2.5, 7.5, 12], [0, 10, -3], [10, 0, -3]]).T

# getting meshgrids from points_to_grid()
mesh_x, mesh_y, mesh_z = points_to_grid(pts, im.shape[1], im.shape[0])

# define if you wish to downsample plotting (higher values=lower resolution)
downsample_factor = 1

# initializing figure
fig = plt.figure(figsize=(9,9))
ax = fig.add_subplot(projection='3d')
ax.view_init(elev=30, azim=45, roll=0)
ax.set_box_aspect([1,1,1])
ax.scatter(pts[0], pts[1], pts[2], c='#526FFF')

# plotting `image[i][j]` at  `[mesh_x[i][j], mesh_y[i][j], mesh_z[i][j]`
ax.plot_surface(mesh_x, mesh_y, mesh_z, facecolors=im,
                rstride=downsample_factor, cstride=downsample_factor,
                antialiased=True, shade=False)
plt.show()