Exercise 1: Homogeneous transforms and projections (3)
References: lec06GeomIntro.pdf slides 51-58, Equations of Lines and Planes , Parametric Equation of a Circle
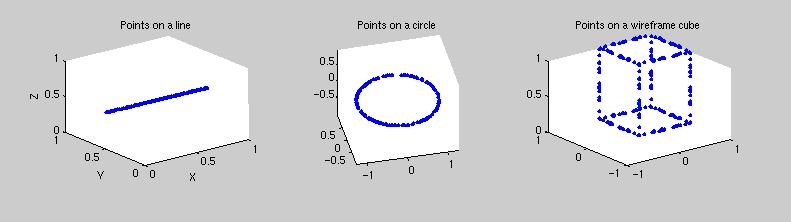
In Matlab, define 3D geometric point "clouds" defining a line, rectangle, circle, and the wireframe edges of a box or cube.
Hint:Use the rand function and transform the resulting uniform distributions so they extend over a line, square etc...
You can check your results using the 3d plotting: "plot3"Define the transforms below using homogeneous coordinates and project each shape above and image (using regular 2D "plot(u,v,'.')") the result under:
Note: Place the camera somewhere outside of the scene so all the points are visible.
- Straight orthographic projection
- Perspective projection without rotation (i.e. the image plane is parallel to the largest face of each 3D shape)
- Perspective projection with one or more rotations (i.e. the image plane is not parallel to the largest face of any 3D shape)
Exercise 2: Camera geometry and stereo (7)
- Figure out what each of the projections mean geometrically and draw (by hand) the corresponding diagrams showing the figure, imaging plane and principle of projection for each projection type.
- What 2D figure does each one of the 3D structures project to?
- Explain the results.
- How does this exercise relate to camera calibration?
- What main property or properties of real-world imaging is not modeled properly?
References: lec06GeomIntro.pdf slide 68, and lect16.pdf (external) slides 12 - 14
a. Focal length (1)
Determine the focal length of the camera using a picture of a ruler placed at a known depth from the camera, parallel with the camera plane. Use 2 or more images and pick the best result. Note that the focal length that you obtain will be measured in pixels.
Hint: Use similar triangles formed with the ruler and its projection in the image; measure the dimension of the sampled line in 3D and image.
b. Determine the 3D structure of a box object using stereo with 2 images (2)
c. Determine the 3D structure of a box object using stereo with a set of images (4)
- Select some features that characterize the structure ( ex. corners of the cube).
- Move the camera on a line perpendicular to the camera axis for a known distance and take a second picture. Select the points corresponding to the ones from the first image.
- Determine the depth of the feature points using corresponding points in the two images.
hint: simple stereo reconstruction with parallel cameras use the focal length determined at question a and the measured distance between the camera positions.
What happens if the translation is not in a plane perpendicular to the camera axis? Try to draw a diagram and explain the results.- Use determined depth to reconstruct the 3D coordinates of the points (in a camera centered coordinate system). Check if the structure is correct (parallel lines are parallel ...).
Synthetic dataReal data
- Build a 3D representation of a box object.
- Project the structure on a set of n (~ 10) images along a line perpendicular to camera axis at regular intervals. Perform a perspective projection with a camera that has the focal length determined in exercise 3a.
- Formulate a least square problem for determining the depth of the feature points using all the images.
- Reconstruct the 3D coordinates and compare the results with the starting structure.
- Move the object (or camera) on a line perpendicular to the camera axis and use MTF to track a set of feature points that characterize the structure. Take images at regular intervals along the line.
Practical hints: To capture a small object put the object on a piece of paper or cardboard. Slide along the edge of a ruler, the bench or other guide. Arrange the camera to point perpendicular to the sliding surface. Alternatively, if you use the webcams, you can have the object fixed and slide the camera along a ruler.- Reconstruct the depth and 3D coordinates of the points as in the case of synthetic data and plot the results. Compare the structure with the real one. Is the structure more accurate than the one from part b)?
In addition to your own captured data, you can use this sample pattern sequence (Stereo.mat) to test your program.
Getting data to matlab:load Stereo
We tracked NrPoints = 16 points on a calibration pattern in NrFrames=9 frames. Here is an image of the pattern and the tracked points. The camera was moved on a line perpendicular to camera axis and the frames are taken at d = 5cm intervals along the line. You can choose f = 100. We stored the tracked points in W of size 2*NrFrames x NrPoints where row i: represents the horizontal coordinate (u) of the points row i+NrFrames: represents the vertical coordinate (v) of the points